Stocks make you a part-owner. Bonds make you a lender. A bond fund owns a basket of these loans on your behalf.
YOU LEND$1,000
The face value in this example.
→
YOU RECEIVE$40 / year
A 4% fixed coupon, paid annually here.
→
AT MATURITY$1,000
The principal comes due.
Illustrative bond issued at face value, with no early repayment. Payments depend on the borrower meeting its obligations. Many real bonds pay interest semiannually; some, including Treasury bills, pay no regular coupon and are sold at a discount.
One bond: a repayment date
If you hold to maturity and the borrower pays, you receive the contractual face value. If you paid $1,050 to buy it from someone else, maturity still returns $1,000, not $1,050.
You may sell before maturity, but the price can be higher or lower than what you paid.
A bond fund: a changing basket
A conventional bond fund replaces securities as its strategy requires. Your shares do not have their own fixed repayment date. Diversification can reduce exposure to one borrower, but cannot eliminate losses.
An exchange-traded fund (ETF) is one fund wrapper, traded on an exchange. Your retirement account may hold a bond mutual fund or bonds inside a target-date fund instead.
A few words you will see along the way
Issuer: the borrower. Principal / face value: the amount contractually due at repayment. Maturity: that repayment date. Default: failing to meet the debt’s payment obligations.
Credit rating: an agency’s opinion of repayment risk. Investment-grade ratings indicate stronger assessed credit quality; below-investment-grade debt is often called high yield. Callable: the issuer can repay early under the bond’s terms, potentially leaving you to reinvest at a lower rate.
Inflation: rising prices that reduce what money buys. Reinvestment risk: future interest or repaid principal may have to be invested at a lower rate. Yield: a rate relating income and/or contractual payments to a price; its exact definition matters.
Imagine your bond pays $40 a year. If newly available bonds offer a better deal, a buyer needs a lower price to make your old payments competitive.
Try it · one fixed-rate bond
The annual coupon stays $40. Principal stays $1,000. Only the discount rate and remaining term change. Annual discounting; no default, call, accrued interest or trading costs.
Calculated resale value$956.71
-$43.29 versus $1,000 face value
New buyers demand more than your 4% coupon. The price falls below face value.
How does “duration” help with a whole fund?
Effective or modified duration estimates price sensitivity to a small change in yields. Approximate price change (%) = −duration × yield change in percentage points. A move from 4% to 5% is +1 percentage point, or 100 basis points.
0.32 years duration
-0.32%
2 years duration
-2.00%
6 years duration
-6.00%
15 years duration
-15.00%
These are price-only illustrations for a +1 percentage point parallel yield move, excluding income. Large moves, curve changes, credit spreads, convexity and changing cash flows can make actual results differ. Duration is not a maturity date or a guaranteed recovery time.
If you must sell, market price matters. Longer duration means greater sensitivity to yield changes. Even a government bond fund can lose money.
Over several years
Higher rates can improve income as payments and maturing bonds are reinvested. Lower rates can reduce future income. This helps explain why short-term losses and better future yields can happen together; it does not establish a recovery date.
Lesson 03
Read a fund page without the guesswork.
Use this as a reusable method: identify the loan basket, decode the headline figures, then inspect exposure, costs and structure.
Worked example · IB01
iShares $ Treasury Bond 0–1 yr UCITS ETF · USD (Acc)
A dated teaching example, not a recommendation. Figures as of 15 October 2026 unless stated. Checked 16 October 2026; not a live feed.
The US government. That answers the borrower question, not whether the fund’s resale price or your home-currency value can fall.
“0–1 year”
When do its bonds mature?
The strategy targets short remaining maturities. It refreshes the basket; your ETF shares do not mature in one year. Short bonds reprice their income relatively quickly as rates change.
“Put cash to work”
What job is being suggested?
Earning income from short-term debt. This marketing phrase does not make an ETF an insured bank deposit or settle whether it fits your spending currency and access needs.
From the lesson to the real screen
Read this screen with me.
These are real, dated screenshots of the same fund. Choose a screen, then a number. The explanations work for similar fields on other services too.
Enlarge the image to inspect small print and numbered markers on small screens. Every numbered explanation is also available in the list below.Source: iShares / BlackRock ↗Captured 16 October 2026. Figures dated 15 October 2026. Screenshot supplied by a reader.Historical teaching image, not a live quote. Numbered overlays are FireFolio’s commentary; no affiliation or endorsement is implied.
Annotation 1 of 4
NAV is a calculated value
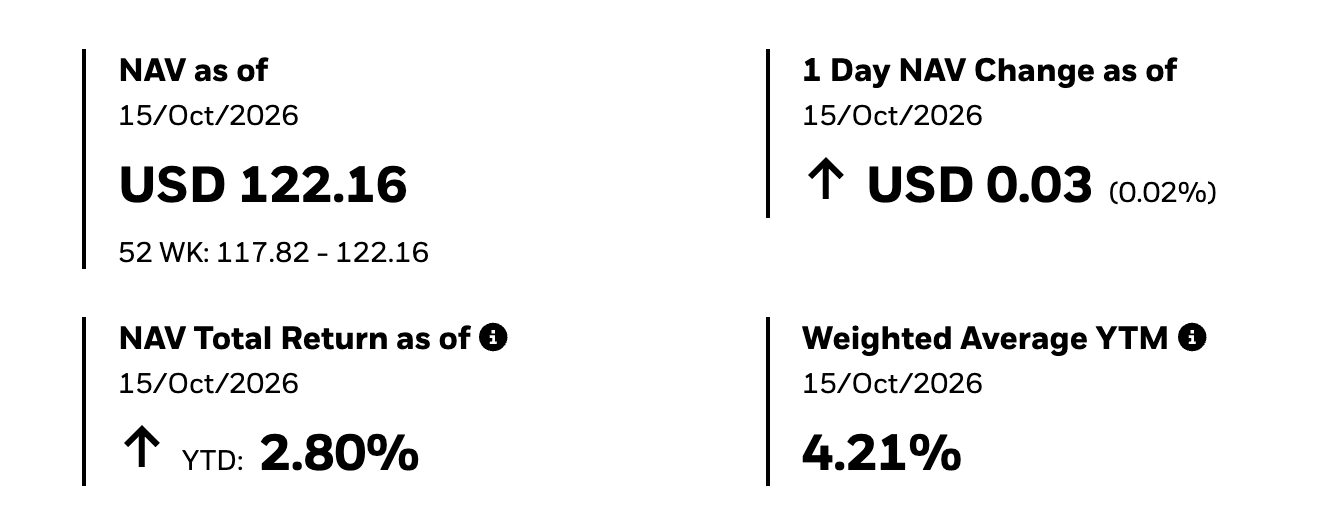
On the screen: USD 122.16
How to read it
Net asset value is assets minus liabilities, divided by shares. This is the value of one fund share at the valuation time.
What to watch out for
Your broker uses an exchange price, which can differ. $122.16 is not a bond’s face value or evidence that the fund is expensive.
Same fund, different numbers: reconcile the two screens
Use the issuer documents to confirm the share class and methodology, then check the date, currency and definition of each field. These snapshots do not establish a synchronized price comparison.
iShares YTM 4.21% / Yahoo “Yield” 0.00%
Different labels. Yahoo’s captured field does not define its yield methodology. Accumulating income and cash payouts are different; neither figure promises your return.
iShares NAV $122.16 / Yahoo NAV 122.13
The iShares figure is dated 15 October. The Yahoo crop does not date its NAV. Check valuation times before interpreting the difference.
iShares YTD 2.80% / Yahoo YTD 2.76%
Align measurement dates and calculation methods. Yahoo’s separate performance section stated 14 October; iShares stated 15 October. The difference is not automatically a fee.
iShares assets $20.59bn / Yahoo assets --
A missing aggregator field is not evidence that a fund has no assets. Confirm fund versus share-class totals in the issuer factsheet.
Try this with a fund you own: find it on the issuer’s website and another service. Match the exact share class, identify one differently named field, then explain why you would or would not compare the two values.
Start with the numbers at the top
Choose a figure to learn what it can actually tell you.
NAV per share
What it means
Net asset value: the fund’s assets minus liabilities, divided by its shares. This is the calculated value of one ETF share, in USD, at the valuation time.
Why it changes
Bond valuations, income earned, expenses, and distributions change NAV. Accumulated income stays inside this share class.
What you cannot conclude
This is neither a bond’s face value nor a guaranteed broker price. A $122 ETF is not inherently more expensive than a $20 ETF. Compare exposures and percentage costs.
Make it concrete
Ten shares represent $1,221.60 at this NAV. The actual purchase uses the exchange ask price, plus any broker fees.
Coupon, YTM, distribution yield: why are they different?
Coupon: the contractual interest rate on a bond’s face value. It ignores what you paid. Current yield: annual coupon divided by today’s price; it ignores the gain or loss on repayment.
Yield to maturity (YTM): the discount rate that equates the purchase price with contractual cash flows. Receiving all payments is assumed; realizing that compounded return also depends on coupon reinvestment. A fund’s weighted YTM is not your locked-in return.
Yield to worst: the lowest yield across relevant contractual maturity and early-call scenarios. It does not include every possible loss from default. Distribution yield: a payout-based measure, often backward-looking. 30-day SEC yield: a standardized US fund-income measure, generally after fund expenses. Check dates, fee treatment and definitions before comparing.
The key facts, translated
Start with exposure and costs. Open any row for why it matters and a question to ask of another fund.
17 facts shown
Underlying borrower & asset classExposureUS Treasury · fixed income
Why it matters
Who owes the money? “Fixed income” describes debt; it does not promise a fixed fund price. Sovereign, corporate, municipal, and mortgage debt have different repayment risks.
What to check
Read the holdings and credit breakdown. Several Treasury securities still share one sovereign borrower.
Maturity & effective durationExposure0.34 years maturity · 0.32 years duration
Why it matters
Maturity measures time to repayment; duration estimates sensitivity to market yields. They are not interchangeable. A duration of 0.32 suggests about a 0.32% price decline for a one-percentage-point yield rise.
What to check
Match the timing to your spending needs. A short average can hide longer holdings; inspect the distribution. Duration is only a local approximation.
Share class, base & trading currenciesExposureShare class USD · base USD
Why it matters
Base currency is fund accounting; share-class currency is its reporting denomination; trading currency is what you pay on an exchange. Underlying currency exposure and explicit hedging determine exchange-rate risk.
What to check
Buying a local-currency listing does not itself hedge foreign assets. Check “Hedged” and the prospectus; hedges have costs and can be imperfect.
Benchmark indexExposureICE U.S. Treasury Short Bond Index (USD)
Why it matters
The index describes the strategy the fund tries to follow. Its borrower, currency, maturity and inclusion rules explain what you own and when holdings change.
What to check
Compare funds with similar benchmarks first. A higher-yield corporate fund is not a like-for-like alternative to a Treasury fund.
Use of incomeCosts & incomeAccumulating
Why it matters
Income stays in the fund rather than being paid out to you. A distributing share class pays cash and normally sees NAV fall by that payment, all else equal.
What to check
Compare total returns. Accumulation does not make income tax-free; account type and local rules determine tax treatment.
Total expense ratio (TER)Costs & income0.07% per year
Why it matters
The recurring fund charge is reflected in NAV. At a constant $10,000 holding, 0.07% is about $7 a year. It is not a separate $7 bill.
What to check
Broker fees, spreads, currency conversion and taxes can sit outside TER. Published NAV returns already reflect ongoing fund expenses; do not deduct TER again.
Securities lending returnCosts & income0.04% · reported 30 June 2026
Why it matters
The fund can earn revenue by lending securities against collateral. That may offset some costs but introduces borrower and collateral risk.
What to check
This is a historical figure for the provider’s reporting period, not a guaranteed rebate. Do not add it again to reported total return or assume TER minus this number is your future cost.
Net assets & net assets of fundStructure$20.59bn share class · $28.02bn fund
Why it matters
Share-class assets are one slice; whole-fund assets include other share classes. Scale can help operating viability, but does not guarantee liquidity or investment quality.
What to check
Do not add these overlapping figures. Inspect bid–ask spreads and underlying-bond liquidity, not size alone.
Shares outstandingStructure168,550,622
Why it matters
The number of shares in the class. ETF creations and redemptions can change it. NAV multiplied by shares is approximately the class’s assets, allowing for rounding.
What to check
More shares does not mean a higher return. Share issuance accompanied by assets is not the same as a company issuing shares to raise spending money.
Inception & fund launch datesStructureBoth 20 February 2019
Why it matters
A share class and its parent fund can start on different dates. Dates tell you how much actual performance history exists.
What to check
Ask which rate and credit environments that history covers. A longer history is context, not evidence that future losses are impossible.
DomicileStructureIreland
Why it matters
The fund’s legal home. This differs from where its bonds were issued, where it trades, and where you pay tax.
What to check
Check broker access and tax treatment for your residence and account. The UK product page is not an indication that this fund suits every country’s retirement account.
UCITSStructureYes
Why it matters
A European regulated fund framework with rules governing fund operations and investor protection.
What to check
It is not deposit insurance, a capital guarantee, or universal account eligibility. Read the risk document for the exact share class.
Physical means the strategy holds securities; sampled means it uses a representative selection rather than necessarily every index constituent.
What to check
Inspect tracking difference, holdings and permitted derivatives. “Physical” does not mean the fund never lends securities or uses derivatives.
Rebalance frequencyStructureMonthly
Why it matters
The portfolio is adjusted to keep following the strategy. As bonds age or mature, the basket is refreshed.
What to check
Monthly rebalancing does not mean monthly cash payments. A 0–1 year fund keeps rolling; it does not promise to give your original investment back after one year.
ISIN & tickerIdentityIE00BGSF1X88 · IB01 on the LSE (USD)
Why it matters
The ISIN identifies this security/share class. Tickers depend on the exchange. Similar fund names can hide different income or hedging policies.
What to check
Match the ISIN, share class, exchange and trading currency in your broker before comparing figures.
SFDR classificationIdentityOther
Why it matters
A sustainability-disclosure classification. iShares uses “Other” for products outside its Article 8 and Article 9 categories.
What to check
This is neither a credit rating nor a safety score. Use the underlying disclosures if sustainability characteristics matter to you.
Manager, custodian & administratorIdentitySee the current product page
Why it matters
The manager operates the strategy; the custodian safeguards assets; the administrator handles fund records and calculations.
What to check
These identify who does what and where to investigate operational issues. Recognizable names do not remove market or counterparty risk.
Lesson 04
A small annual fee is only one cost.
For a short holding period, buying, selling and converting currency can cost more than the fund’s annual charge.
Try it · a constant $10,000 holding
Illustrative total ownership cost$17.00
Ongoing fund expenses
$7.00
Spread + commissions
$10.00
Currency conversion
$0.00
0.17% per year, simple annualized cost equivalent.
No market return assumed. Constant balance and same spread at entry/exit; half the spread each way. FX applies twice only if you convert both ways. Excludes tax, platform fees, internal transaction costs and changes in premium/discount. This is cost arithmetic, not a return forecast.
Costs inside the fund
TER/OCF or expense ratio reduces fund value over time. Portfolio transaction costs and hedging effects also matter. Tracking difference compares the fund’s realized return with its benchmark; it already reflects multiple effects, so do not simply add it to TER.
Costs when you trade or hold
The bid is what a buyer offers; the ask is what a seller wants. Their gap is the spread. Check broker commission, custody/platform charges, currency conversion and market price versus NAV. A premium that disappears before you sell can reduce your return.
What about individual bonds and taxes?
Individual bonds may have dealer markups/markdowns and minimum purchase sizes rather than a fund expense ratio. The quoted “clean” price may exclude accrued interest. Accrued interest compensates the seller for interest earned since the last coupon; it is part of settlement, not an extra management fee.
Compare after-tax outcomes only with the rules for your country, account and security. Income, capital gains, inflation adjustments and accumulated fund income can receive different treatment. This educator does not calculate tax or assume the UK example is eligible in your account.
A higher yield may mean more risk, a different currency, or a longer wait. First decide when you need the money and which surprises you can absorb.
Ways to hold money: roles and tradeoffs, not a ranking
Option
What it can help with
What to investigate
Cash / insured savings
Near-term payments and ready access.
Inflation, variable interest, withdrawal rules and local insurance limits.
Money market fund
A fund of very short-term instruments.
Credit and liquidity risk, changing income and fees. It is not an insured bank account.
Individual high-quality bond
A contractual payment schedule for a known date.
Issuer, maturity, purchase price, call terms, inflation and resale costs.
Short-duration bond fund
Diversified bond exposure with lower rate sensitivity than a comparable longer-duration fund.
Credit and FX risk still matter. Income resets as holdings roll; no guaranteed final value.
Intermediate / long bond fund
Longer exposure to rates; a possible component of a diversified portfolio.
Larger price swings. Government and corporate versions have very different credit risks.
High-yield corporate bonds
Income from riskier borrowers.
Default and recovery risk; spreads can widen during the same stress that hurts stocks.
Inflation-linked bonds
Payments linked to a specified inflation index.
Real-yield sensitivity, index rules, tax and maturity. A fund can still fall in price.
Stocks / stock funds
Long-term participation in business growth.
Large drawdowns, uncertain dividends and no promised maturity payment.
Four ways to think about a bond strategy
Match a known spending date
Hold a bond maturing around the date you need the money, allowing time for settlement.
The tradeoff
Repayment is face value, not necessarily your purchase price, and depends on the issuer paying. Selling early exposes you to market prices. Inflation and opportunity cost remain.
Compare it with
Compare with a suitable insured deposit or term deposit in the spending currency, including access restrictions and local protection limits.
What makes two bond funds a fair comparison?
Line up the same holding period and spending currency, then compare borrower type, credit quality, duration, maturity mix, currency hedging, income policy and total costs. Check whether either fund uses leverage, derivatives or callable debt. Compare the same kind of yield on the same date and total returns over the same period.
For example, a hypothetical 6% corporate fund with duration 7 and a 4% Treasury fund with duration 0.3 differ in both credit risk and rate sensitivity. Their yields alone cannot tell you which fits next year’s spending.
One easily missed comparison · currency
A 4% USD return can be a loss at home.
Assume an unhedged asset earns 4% in USD over one year. Change the value of USD in your spending currency.
Return in your spending currency-1.20%
(1 + asset return) × (1 + currency change) − 1
Hypothetical 4% return, not IB01’s forecast or YTM. No fees, tax or hedging. Exchange-rate movement is separate from the broker’s FX conversion fee.
Lesson 06
Know what deserves your attention.
You do not need to predict every rate decision. Watch the risks that could interfere with the job you gave your money.
Market yields & duration
Short-term effect
A rise in relevant market yields usually reduces existing fixed-rate bond prices.
Long-term effect / what to monitor
Reinvested money can earn more after a rise; after cuts, income can decline. A central-bank announcement is not a one-for-one move in every bond yield.
Credit quality & credit spreads
Short-term effect
A spread is extra yield over a comparable government bond. Wider spreads can hurt corporate prices even if government yields fall.
Long-term effect / what to monitor
Watch issuer finances, downgrades and concentration. High yield can come with meaningful default losses; ratings are opinions, not promises.
Inflation & real yields
Short-term effect
Inflation surprises can affect market yields and prices.
Long-term effect / what to monitor
Fixed payments may buy less. Inflation-linked bonds respond to their specified inflation index, but can fall when real yields rise.
Currency & hedging
Short-term effect
Foreign exchange moves can outweigh a short bond’s interest income.
Long-term effect / what to monitor
Use the currency of future spending as your reference. Hedging reduces some currency risk, with costs and imperfect results.
Liquidity, spreads & premium/discount
Short-term effect
Selling urgently can mean a wider spread or an ETF price below NAV.
Long-term effect / what to monitor
Watch persistent changes in trading conditions and fund viability. On-screen trading volume alone misses underlying-market liquidity.
Income, costs & strategy drift
Short-term effect
A distribution is a transfer out of NAV, not free additional return.
Long-term effect / what to monitor
Review duration, credit mix, fees and index changes. A rising payout or yield can signal changed risk rather than an improved investment.
Your first exercise · use a fund you already own
Open your retirement account’s fund factsheet.
No trade needed. Find these answers, one at a time. Your progress lasts for this visit.
0 of 5 explored. Missing information is a useful question for the plan provider.
Review when your needs change
A spending date gets closer, your cash needs change, the fund changes strategy, or its duration and credit mix drift from your expectations. Daily price movement alone does not tell you to trade.