
Possibly, with a sufficiently large income-to-spending gap. But the evidence cannot tell us that Pete Adeney would reach the same milestone at the same age starting today. His savings principle still works; reproducing his circumstances is a harder question. We can test one concrete change in his local housing market, then calculate what different budgets require. That is more useful than declaring early retirement either dead or effortless.
What his actual path included
Adeney’s retrospective describes two earners, growing salaries, and property alongside investments. By year five, he reports earnings of $100,000 and his partner’s $60,000. He bought a $235,000 home with $47,000 down. Later, moving to a cheaper house allowed the first to become a rental. His year-nine stash of roughly $720,000 included property appreciation; it was not simply a liquid stock portfolio.
Leaving salaried work also did not mean never earning again: he describes housebuilding and other paid work. These details do not invalidate financial independence. They identify the conditions a comparison must include. His figures are recalled approximations, and the early career spans Canada and the United States. We cannot reconstruct a precise annual, after-tax household budget from them.
Sources: Mr. Money Mustache · A Brief History of the ’Stash ↗ (opens in a new tab)
One changed condition: the price of entry
For an illustrative local comparison, we use Q2 2000 for the purchase: his narrative places the move into the home in the May following late 1999. The FHFA Boulder metro house price index rose from 149.63 in that quarter to 471.64 in Q2 2026, the latest available quarter checked for this article. That is a factor of about 3.15.
Applying that factor to $235,000 gives about $741,000. Keeping the same 20% down-payment fraction gives about $148,000. This is an index-scaled illustration, not an appraisal of his house or the price of a particular home available today. Both figures are nominal dollars. They do not measure the change relative to wages or general inflation, and they omit mortgage rates, taxes, insurance, maintenance, and closing costs.
| Measure | Original purchase | Q2 2026 index-scaled illustration |
|---|---|---|
| Home price | $235,000 | $740,730 |
| 20% down payment | $47,000 | $148,146 |
| Boulder metro index | 149.63 (Q2 2000) | 471.64 (Q2 2026) |
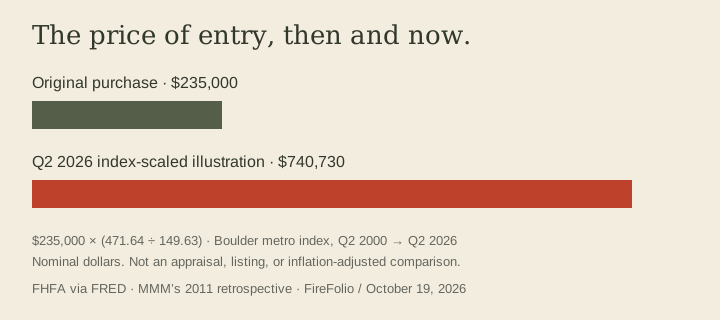
Sources: Mr. Money Mustache · A Brief History of the ’Stash ↗ (opens in a new tab) · FHFA via FRED · Boulder house price index ↗ (opens in a new tab)
He already knows housing is a problem
In his 2024 housing essay, MMM explicitly discusses higher local prices and argues for changing the housing search and spending choices. Our addition is not the discovery that housing matters. It is a dated local comparison paired with a tool that puts the cost of a recurring constraint into years.
A lower-priced location, renting, sharing a home, or earning more can change a budget. Whether any is feasible depends on work, health, family, and the household’s preferences. The housing index alone cannot prove that retiring at 30 became impossible. Nor does a savings formula establish that every household can choose the same savings rate.
Sources: Mr. Money Mustache · How To Afford a House These Days ↗ (opens in a new tab)
Could you? Change the budget, watch the date
Start with a hypothetical household taking home $100,000 a year, spending $50,000 both now and in retirement, and investing the rest from a zero balance. With a constant 5% annual return after inflation and a 4% initial withdrawal assumption, its $1.25 million target takes about 16.4 years to reach with monthly deposits.
Add $1,000 a month to ongoing costs and the annual contribution falls to $38,000 while the target rises to $1.55 million. The result becomes 22.5 years: about six extra years from one recurring bill. That $1,000 is a sensitivity test you can change, not a mortgage estimate inferred from the house-price comparison. A mortgage that ends before retirement belongs in current spending only; the slider deliberately tests a cost that continues.
COULD YOU? / CHANGE ONE CONDITION
The price of an extra monthly bill.
Use today’s dollars. The comparison adds the same ongoing cost before and during retirement. These are hypothetical budgets, not MMM’s finances.
6.1 additional years to the target in this illustration.
How this calculation works
Target = annual retirement spending ÷ withdrawal assumption. Each month, investments grow by (1 + annual real return)^(1/12) − 1, then receive one twelfth of annual income minus current spending. The result is the first month reaching the target, rounded here to one decimal year. A target already reached displays immediately.
The chart uses a common 50-year scale; longer timelines fill the bar. Zero contributions can still reach the target through growth. A budget deficit has no timeline. The model stops after 100 years.
Constant purchasing power, income, expenses and returns. No taxes on investments, fees, debt, property equity, pension income, or market volatility are modeled. Include expected withdrawal taxes and healthcare in retirement spending. A 4% assumption does not establish that a 50-year retirement is sustainable. The full FIRE planner uses a different retirement model.
What would retiring at 30 actually require?
For someone starting at 22 with no investments, age 30 allows eight saving years. In the same simplified model, saving about 72% of take-home income gets close to that eight-year target if spending remains the same in retirement. A household taking home $150,000 and spending $42,000 saves 72%; one spending $75,000 saves 50%. Enter either budget above to see the difference. These are hypothetical conditions, not claims about typical earnings or Adeney’s exact timeline.
So the useful answer is conditional: the arithmetic can still produce early independence for a high-surplus household. We cannot establish that an identical modern career, property purchase, and investment path would get him there at 30. A longer timeline does not mean the underlying idea failed. It may mean the household has a smaller gap between income and necessary costs, a different definition of retirement, or fewer years left to accumulate.
The next decision need not be full retirement. A funded career break or a lower-paid job may buy useful freedom earlier. Compare the cash required for that choice separately from the long-term investment target.
Compare a career break or pay cut with Life scenarios →
Read the original.
- Mr. Money Mustache · The Shockingly Simple Math Behind Early Retirement ↗ (opens in a new tab)
Published January 13, 2012. Read its assumptions alongside the arithmetic.
- Mr. Money Mustache · A Brief History of the ’Stash ↗ (opens in a new tab)
September 15, 2011. His approximate retrospective, not audited annual accounts.
- FHFA via FRED · Boulder house price index ↗ (opens in a new tab)
All-transactions, not seasonally adjusted. Q2 2000: 149.63; Q2 2026: 471.64. Data checked October 19, 2026.
- Mr. Money Mustache · How To Afford a House These Days ↗ (opens in a new tab)
February 3, 2024. His own response to the housing-affordability objection.
The FIRE application and exercises are FireFolio’s original interpretation. No affiliation or endorsement is implied. Sources checked October 19, 2026. Educational material, not individualized investment advice.