
A company can have an enormous market value while its price-to-earnings ratio falls. If earnings per share grow faster than the share price, investors pay less for each dollar of those earnings even as the stock rises. NVIDIA makes this distinction worth understanding. A lower P/E tells us something about the relationship between price and measured profits; deciding whether the shares offer good value also requires a view about how durable those profits are.
What the NVIDIA chart actually tells us
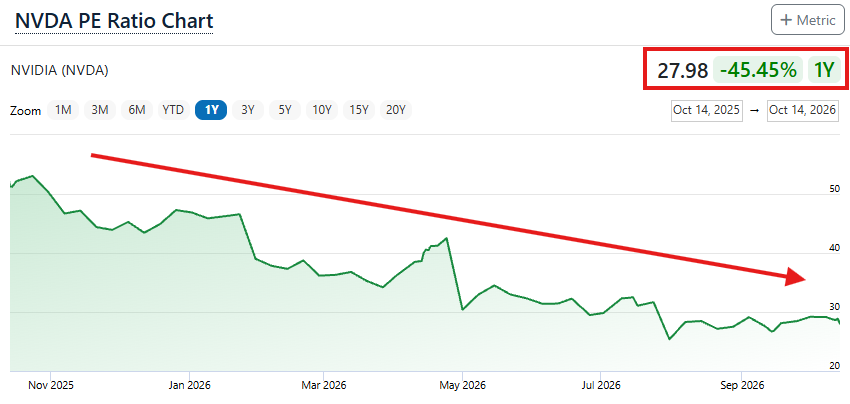
The reader-supplied NVDA chart behind this question covers October 14, 2025 through October 14, 2026. It displays a P/E of 27.98 and a one-year change of −45.45%. That percentage describes the ratio’s change. It does not mean the stock price fell 45.45%, or that an investor can now buy the business at a 45.45% discount to fair value.
Taking the rounded display at face value implies a starting multiple near 51.29: 27.98 divided by 0.5455. The crop does not identify its earnings methodology, so those values are a dated chart observation, not a verified live quote or a confirmed trailing-GAAP series. Before comparing it with another P/E, check the provider’s definition.
With a consistent definition and positive earnings, a falling P/E means price has grown less, or declined more, than EPS on a proportional basis. It could reflect rapidly rising profits, a falling stock price, or both. The ratio alone cannot tell us how much came from each. Reading the price and EPS series alongside it resolves that question.
Sources: Fidelity · Price to Earnings Ratio ↗ (opens in a new tab)
A rising stock can have a falling P/E
P/E equals share price divided by annual earnings per share. A $100 stock with $2 of annual EPS trades at 50 times earnings. If the price rises to $140 while EPS doubles to $4, the new P/E is 35. The stock gained 40%, earnings grew 100%, and the multiple fell 30%. All three statements are true.
The arithmetic is: new P/E divided by old P/E equals the price growth factor divided by the EPS growth factor. In that example, 1.40 divided by 2.00 equals 0.70. This describes what happened; it does not establish what investors should pay next.
Market capitalization measures the equity’s total market value: share price multiplied by shares outstanding. P/E measures price relative to earnings. Calling a market cap “huge” describes scale. Calling a stock “expensive” requires a comparison with the future cash it can plausibly generate and the risk of receiving it. The two judgments should not be used interchangeably.
| What changes | New price | New annual EPS | New P/E |
|---|---|---|---|
| Price rises, earnings grow faster | $140 | $4.00 | 35× |
| Price falls, earnings stay flat | $70 | $2.00 | 35× |
| Price falls faster than earnings | $60 | $1.50 | 40× |
| Price stays flat, earnings fall | $100 | $1.00 | 100× |
NVIDIA shows why the earnings definition matters
NVIDIA reported $96.2 billion of revenue for the quarter ended July 26, 2026, up 106% from a year earlier. GAAP diluted EPS rose from $1.08 to $2.46. That is substantial growth in the earnings denominator, although one quarter cannot explain a full year’s P/E movement. Its fiscal 2027 label refers here to a quarter in calendar 2026.
For that quarter, adjusted, or non-GAAP, diluted EPS was $2.22, below GAAP EPS of $2.46. The 10-Q reports $7.771 billion of net gains from equity securities, primarily unrealized, within other income. Investment gains can increase reported earnings without being profits from selling more chips. Their repeatability deserves a separate judgment.
NVIDIA’s release reconciles the two earnings measures and says its non-GAAP results now include stock-based compensation, with the historical comparisons presented updated accordingly. Adjusted earnings are not automatically higher, and their definition can change. Read the reconciliation before assuming that two charts use comparable profits.
A trailing annual denominator usually adds the latest four reported quarters. A strong quarter replaces the year-earlier quarter when results become available, so the P/E can step down even without a price decline. Multiplying the latest quarter by four instead creates an annualized run rate. That is a different assumption and should be labeled as such.
Sources: NVIDIA · Second-quarter fiscal 2027 results ↗ (opens in a new tab) · NVIDIA · Form 10-Q for July 26, 2026 ↗ (opens in a new tab)
Which P/E are people talking about?
Trailing versus forward describes the time period. GAAP versus adjusted describes the accounting basis. These are separate choices: a forward P/E can use estimated adjusted earnings, while a trailing P/E can use reported GAAP earnings. Basic versus diluted EPS adds another distinction; diluted EPS accounts for potential dilution under accounting rules.
At an invented price of $140, trailing EPS of $5 produces a P/E of 28. Forecast EPS of $7 produces a forward P/E of 20. The lower forward ratio reflects a larger estimated denominator. It does not mean that expected growth is free or certain. If the estimate is cut to $5.60 with price unchanged, forward P/E rises to 25.
| Label | Earnings in the denominator | Question to ask |
|---|---|---|
| Trailing / TTM | Usually the latest four reported quarters | Does this include unusual gains or a peak in profits? |
| Forward | An estimate for a specified future period | Next 12 months, current fiscal year, or next fiscal year? Whose estimate? |
| GAAP | Earnings under US accounting standards | Which non-operating items affected profit? |
| Adjusted / non-GAAP | Earnings with specified exclusions or adjustments | What was removed, and does it recur? |
| Annualized latest quarter | One quarter multiplied by four | Would seasonality or changing margins make that misleading? |
Sources: Aswath Damodaran · Earnings Multiples ↗ (opens in a new tab) · Fidelity · Research glossary: P/E ↗ (opens in a new tab)
Why a lower P/E does not settle whether a stock is cheap
A low multiple can reflect modest growth, substantial risk, or temporarily high profits. Imagine a cyclical business earning $10 per share at an $80 price: its P/E is 8. If sustainable earnings turn out to be $4, the same price is 20 times that earning power. The initial low ratio was real; the assumption that those earnings would persist was the weak point.
A high multiple can reflect expected growth, durable economics, or excessive optimism. Compare businesses with similar growth prospects, risks, capital needs, and accounting. A company’s own historical multiple is useful context, but its growth runway and interest-rate environment may have changed. There is no universal P/E that makes every stock a bargain.
For NVIDIA, a useful research question is how much future profit depends on sustained customer spending, margins, and investment gains. Its filing discusses customer concentration and constraints on AI infrastructure deployment. Those disclosures help frame scenarios; neither a strong recent quarter nor a declining multiple resolves them.
Sources: Aswath Damodaran · Earnings Multiples ↗ (opens in a new tab) · NVIDIA · Form 10-Q for July 26, 2026 ↗ (opens in a new tab)
Earnings can rise while shareholders lose money
Share price equals EPS multiplied by P/E. That means EPS growth and a change in the multiple work together. Holding the EPS definition constant, the price-return factor equals the EPS growth factor multiplied by the change in P/E. Dividends would add a separate component of total return.
Start with an illustrative 28× multiple. If annual EPS rises 20% but the ending multiple is 20×, the price factor is 1.20 × 20 ÷ 28, or about 0.857. Earnings grew, yet the stock lost roughly 14.3%. If profits shrink at the same time that investors pay less for them, the effects compound.
| Annual EPS change | Ending P/E | Implied price change |
|---|---|---|
| +20% | 28× | +20.0% |
| +20% | 20× | −14.3% |
| 0% | 20× | −28.6% |
| −20% | 20× | −42.9% |
Common P/E claims and the missing context
Many apparent contradictions come from changing the denominator, comparing different time periods, or treating a relative measure as a complete valuation. Translate the claim into a calculation before deciding whether it changes your view.
| The claim | What to check |
|---|---|
| “P/E fell, so the stock is cheap.” | Price fell relative to the chosen earnings measure. Are those earnings sustainable, and is the new price attractive? |
| “Forward P/E is much lower.” | The forecast denominator is larger. Check the forecast period, accounting basis, and estimate revisions. |
| “A 28× P/E means a 3.6% return.” | 1 ÷ 28 is a 3.57% earnings yield. It is not a dividend yield, guaranteed return, or FIRE withdrawal rate. |
| “A 28× P/E means I get my money back in 28 years.” | That would require constant earnings fully paid to you, ignoring the time value of money. P/E is not a payback promise. |
| “Negative P/E is even cheaper.” | Negative EPS means a loss. Zero or negative earnings make the usual positive-P/E ranking unhelpful. |
| “The stock split made it cheaper.” | A pure split adjusts price and EPS proportionally. P/E is unchanged when both are on the same split basis. |
| “It is below its old P/E, so it must return there.” | Historical multiples are observations, not destinations. Business prospects and required returns can change. |
Sources: Fidelity · Price to Earnings Ratio ↗ (opens in a new tab) · Aswath Damodaran · Earnings Multiples ↗ (opens in a new tab)
Does PEG solve the growth problem?
PEG divides P/E by an annual EPS growth rate expressed as a percentage number. A P/E of 28 divided by an assumed 20% growth rate gives 1.4, using 20 rather than 0.20 in the denominator. Change that growth assumption to 40%, and PEG becomes 0.7 without changing the stock price.
That sensitivity is the point to investigate. Check whether the growth is historical or forecast, whether it is annualized over several years, and whether it matches the earnings basis. A PEG below one is a screening convention, not proof of undervaluation. It cannot tell you how long exceptional growth will last or how much cash and investment it requires.
Sources: Charles Schwab · What Is the PEG Ratio? Basics, Formula, and Risks ↗ (opens in a new tab)
Use valuation to test your FIRE plan
Before acting on a P/E headline, write down five things: the price date, the EPS period, the accounting basis, what changed in price versus earnings, and the assumptions needed for future profits. Then examine cash generation, reinvestment needs, and the balance sheet. A valuation ratio is a starting point for those questions.
Next, connect the stock to your household. Include exposure inside funds as well as shares held directly. For an invented $1 million portfolio with a 20% total position in one company, a 40% decline in that company reduces the portfolio by $80,000, or 8%, if every other holding stays flat. Other investments and employment income might also weaken; the isolated calculation does not capture that.
A lower P/E does not by itself justify a larger position, an earlier retirement date, or a higher assumed portfolio return. Check whether your plan still works with less favorable investment outcomes and what adjustment would be feasible. NVIDIA’s falling multiple can be consistent with impressive business growth. Your financial independence still depends on the price you pay, the outcome you receive, and how much of your life relies on it.
Read the original.
- Fidelity · Price to Earnings Ratio ↗ (opens in a new tab)
The price divided by earnings-per-share definition and the interpretation of a multiple. Checked October 21, 2026.
- NVIDIA · Second-quarter fiscal 2027 results ↗ (opens in a new tab)
Released August 26, 2026, for the quarter ended July 26, 2026. Includes GAAP and non-GAAP reconciliations and the change to stock-compensation treatment. These are quarterly figures, not trailing annual EPS.
- NVIDIA · Form 10-Q for July 26, 2026 ↗ (opens in a new tab)
See Other Income, Net for equity-investment gains and the customer and risk disclosures for the durability of earnings. Checked October 21, 2026.
- Aswath Damodaran · Earnings Multiples ↗ (opens in a new tab)
Valuation framework covering earnings definitions, growth, risk, reinvestment, and PEG. Historical examples are not current market benchmarks.
- Fidelity · Research glossary: P/E ↗ (opens in a new tab)
Illustrates provider-specific definitions, including trailing four-quarter earnings and historical-series conventions. Do not assume every vendor uses the same method.
- Charles Schwab · What Is the PEG Ratio? Basics, Formula, and Risks ↗ (opens in a new tab)
June 3, 2026. Growth assumptions, consistent inputs, and limitations for cyclical or unusually fast-growing companies.
The FIRE application and exercises are FireFolio’s original interpretation. No affiliation or endorsement is implied. Sources checked October 21, 2026. Educational material, not individualized investment advice.